Journal Information
Journal ID (publisher-id): BM
Journal ID (nlm-ta): Biochem Med (Zagreb)
Title: Biochemia Medica
Abbreviated Title: Biochem. Med. (Zagreb)
ISSN (print): 1330-0962
ISSN (electronic): 1846-7482
Publisher: Croatian Society of Medical Biochemistry and Laboratory Medicine
Article Information
Copyright statement: ©Croatian Society of Medical Biochemistry and Laboratory Medicine.
Copyright: 2025, Croatian Society of Medical Biochemistry
License (open-access):
This is an Open Access article distributed under the terms of the Creative Commons Attribution (http://creativecommons.org/licenses/by/4.0/) which permits unrestricted non-commercial use, distribution, and reproduction in any medium, provided the original work is properly cited.
Date received: 22 September 2024
Date accepted: 30 January 2025
Publication date: 15 April 2025
Publication date: 15 April 2025
Volume: 35
Issue: 2
Electronic Location Identifier: 020701
Publisher ID: bm-35-2-020701
DOI: 10.11613/BM.2025.020701
Use of Hoteling’s T2 multivariate control chart for effective monitoring of a laboratory test with a 3-level quality control scheme
Cristiano Ialongo[*]
Author notes:
[*] Corresponding author: cristiano.ialongo@uniroma1.it
Author contributions
C Ialongo: Conceptualization, Methodology, Formal analysis, Writing.
• Multi-level quality control controls the analytical process at different target values
• Multi-level quality control may show correlation between different quality control levels
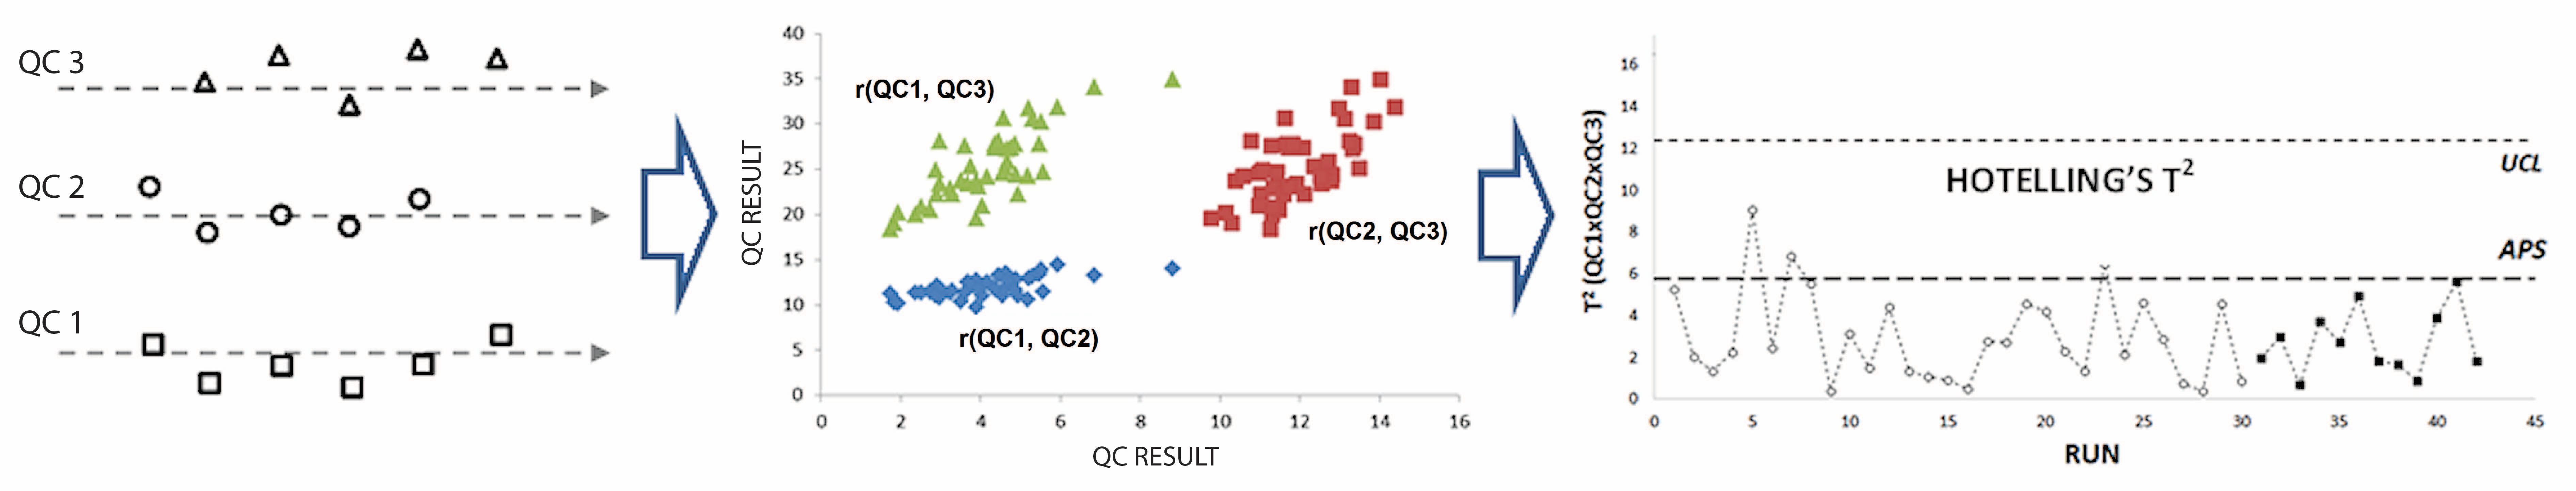
• Hotelling’s T2 statistic is used to create a multivariate control chart for laboratory tests
• Multivariate control charts account for correlations between multiple quality control levels
• The Multivariate control charts are more resistant to false alarms than univariate control charts
Introduction
A control chart based on Hotelling’s T2 multivariate statistics was used to monitor the quality of an immunoenzymatic assay for plasma levetiracetam. The chart incorporated a multi-level quality control (MLQC) system with three concentration levels of the analyte and included the analytical performance specification (APS) for therapeutic drug monitoring.
Materials and methods
Data were collected from March 1 to August 14, 2024, comprising 84 consecutive triplets of values for the three MLQC levels. The initial 59 triplets were used to estimate the variance-covariance matrix and vector of means (phase I). These estimates were then applied to calculate Hotelling’s T2 for the remaining 25 triplets (phase II). The pharmacokinetic model of Fraser was employed to derive the APS for levetiracetam, based on a twice-daily dosing scheme and a median half-life of 8 hours.
Results
The three MLQC levels showed significant correlations (r > 0.6) in both control phases. The Hotelling’s T2 control chart detected no out-of-specifications states (OC), compared to 12 OC signals from individual Levey-Jennings charts monitoring the MLQC levels separately. The integration of the APS into the Hotelling’s T2 chart provided additional insights into the process quality, and in two instances, it aligned with the OC signal from at least one of the Levey-Jennings charts.
Conclusions
Hotelling’s T2 multivariate chart is effective for internal quality control of laboratory tests. As MLQC data offer correlated information, this approach is advantageous over multiple individual univariate charts as it ensures the correct level of false positive and false negative alarms.
Keywords: quality control; analytical performance specification; multivariate analysis; analytical process